
Pipeline Stages: Fetch, Decode, Execute, Memory, Write-Back
Learn the five CPU pipeline stages, how data hazards cause stalls, and code techniques to keep embedded pipelines full for predictable performance.
Contents & prerequisites
Why Pipeline Architecture Matters in Embedded Systems
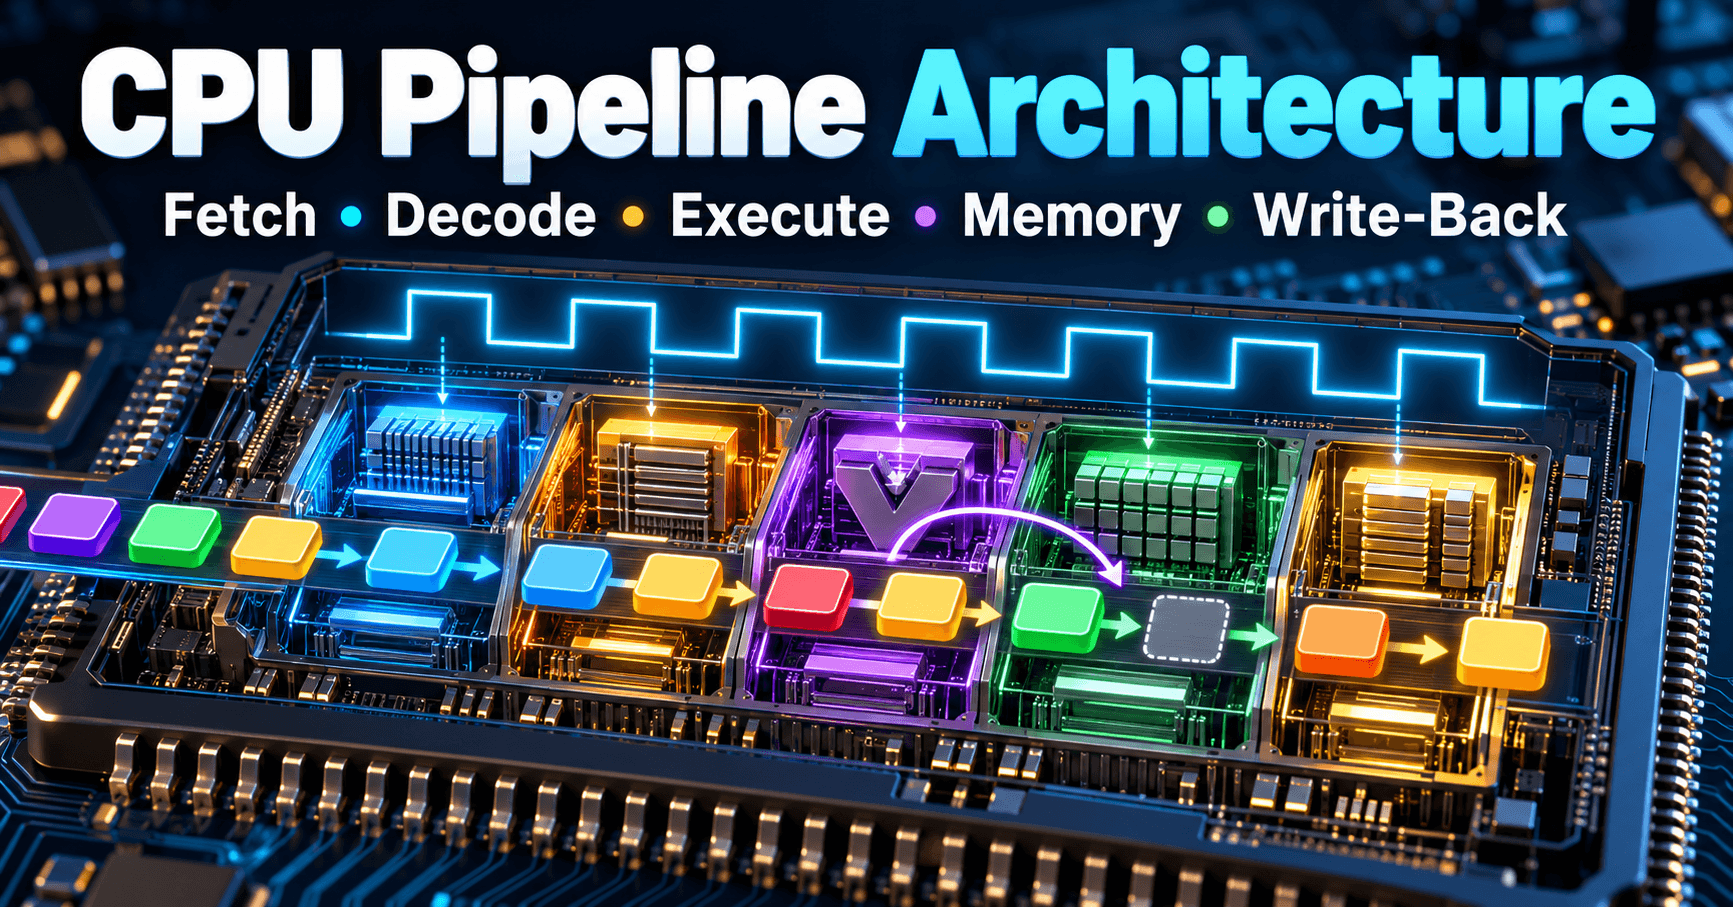
A non-pipelined CPU finishes one instruction completely before starting the next: fetch, decode, execute, access memory, write the result back, then repeat. A pipelined CPU overlaps these steps across multiple instructions in flight simultaneously, the way an assembly line overlaps work on different cars. The clock can run faster because each stage does less work per cycle, and in steady state the processor retires close to one instruction per cycle instead of one instruction per five cycles.
Throughput vs. latency trade-offs
Pipelining improves throughput — instructions completed per second — without necessarily improving the latency of any single instruction. A load instruction might still take five cycles from fetch to write-back; the win is that four other instructions are being processed concurrently during those five cycles. For embedded developers this distinction matters: an interrupt handler's worst-case latency is governed by pipeline depth and drain time, not by the steady-state throughput number quoted in a datasheet.
Pipeline depth and real-time constraints
Deeper pipelines (more stages, less work per stage) allow higher clock frequencies but increase the penalty for anything that disrupts the flow — branch mispredictions, exceptions, cache misses. Every pipeline stage that is in flight when a disruption occurs may need to be flushed and refilled. For a hard real-time system, this means worst-case execution time (WCET) analysis must account for pipeline flush cost on every branch and interrupt entry point, not just average-case behavior. A deeper pipeline makes average throughput better but makes worst-case timing harder to bound tightly.
ARM Cortex-M and Cortex-A pipeline differences
Cortex-M cores aimed at deterministic microcontroller workloads typically use short, in-order pipelines — commonly three stages on simpler cores and a few more on cores like the Cortex-M4/M7 — specifically to keep interrupt latency low and timing predictable. Cortex-A application cores target throughput and use longer, often superscalar, out-of-order pipelines with branch prediction, speculative execution, and multiple issue slots. The Cortex-A design extracts more instructions per cycle on average but has much more variable per-instruction latency, which is why Cortex-A is rarely the choice for hard-deadline control loops and Cortex-M dominates that space. Always check the specific core's technical reference manual for actual stage count and interrupt latency cycles — these vary by implementation and configuration (e.g., with or without an FPU or cache).
The Five Classic Pipeline Stages
Fetch: Instruction retrieval and program counter management
The Fetch stage reads the instruction word pointed to by the program counter (PC) from instruction memory or the instruction cache, then increments the PC for the next cycle. On a taken branch, the PC must be redirected, which is the root cause of control hazards discussed below. Fetch bandwidth is limited by instruction cache hit rate and bus width — a cache miss here stalls everything downstream.
Decode: Instruction interpretation and control signal generation
Decode splits the fetched word into opcode, register fields, and immediate values, and generates the control signals that tell the Execute, Memory, and Write-Back stages what to do. This stage also reads source operands from the register file. Many RISC pipelines perform register-file read during Decode so that Execute can start immediately with valid operand values.
Execute: ALU operations and address computation
Execute performs arithmetic, logic, shifts, and comparisons, and for load/store instructions it computes the effective memory address (base + offset). Branch condition evaluation often happens here too, which is one reason branch outcomes aren't known until partway through the pipeline — instructions fetched after the branch may already be in-flight before the branch resolves.
Memory: Load/store operations and cache interaction
The Memory stage accesses data memory for loads and stores; ALU-only instructions simply pass their result through this stage unchanged. This is where data cache behavior dominates timing: an L1 data cache hit might cost one cycle, while a miss serviced from L2 or external DRAM can cost tens of cycles, stalling the stage and everything behind it. Understanding cache architecture across I-cache, D-cache, and unified L2 is essential to predicting how often this stage will stall in a given workload.
Write-Back: Register file updates and result forwarding
Write-Back commits the final result into the register file. On many pipelines this stage also feeds a forwarding (bypass) network so that a subsequent instruction waiting on this result doesn't need to wait for the value to actually land in the register file — it can grab it directly off the forwarding bus a cycle earlier.
Data Dependencies and Pipeline Hazards
Read-after-write (RAW) hazards and stalls
A RAW hazard occurs when an instruction needs a register value that a preceding instruction hasn't finished computing yet. Example:
ADD  R1, R2, R3   ; R1 = R2 + R3
SUB  R4, R1, R5   ; needs R1 immediately
Without mitigation, SUB would stall in Decode until ADD's result reaches Write-Back — a multi-cycle bubble.
Structural hazards and resource conflicts
A structural hazard arises when two instructions in different pipeline stages need the same hardware resource in the same cycle — classically, a single memory port needed simultaneously by Fetch (for the next instruction) and Memory (for a load/store in an older instruction). Harvard architectures with separate instruction and data caches, common on Cortex-M cores, eliminate this specific conflict by giving Fetch and Memory independent ports.
Control hazards and branch pipeline flushes
Branches aren't resolved until Execute (or later), but Fetch has already speculatively pulled in subsequent instructions assuming no branch, or following a prediction. If that guess is wrong, every instruction fetched after the branch must be flushed and refetched from the correct target, costing cycles equal to roughly the pipeline depth up to the resolution stage. Modern cores reduce this cost with prediction schemes; the mechanics of static and dynamic branch prediction using 2-bit saturating counters directly determine how often this flush penalty is paid.
Forwarding paths to minimize stall cycles
Forwarding (bypassing) routes a result from the output of Execute or Memory directly back to the input of Execute for a dependent instruction, skipping the wait for Write-Back. Forwarding eliminates most RAW stalls for back-to-back ALU operations but cannot eliminate the load-use hazard: a load's data isn't available until after Memory, so an instruction immediately consuming a loaded value typically still stalls one cycle even with forwarding present.
Pipeline Stalls and Throughput Loss
Memory latency penalties and cache misses
A data cache miss that goes to main memory can cost tens to over a hundred cycles depending on DRAM timing and bus arbitration, during which the Memory stage holds its position and every stage behind it stalls. This is the single largest source of real-world IPC loss in embedded applications with non-trivial data sets.
Instruction dependencies forcing serialization
Chains of dependent instructions (each needing the prior result) prevent the pipeline from overlapping them regardless of forwarding, because forwarding reduces stall cycles but can't make Execute happen before the producing instruction finishes Execute.
Branch misprediction recovery overhead
On an in-order Cortex-M pipeline, a misprediction might cost 1-3 cycles; on a deep out-of-order Cortex-A pipeline it can cost 10-20 cycles or more, since many more speculative instructions must be discarded. This makes branch-heavy code (deeply nested conditionals, unpredictable data-dependent branches) disproportionately expensive on application cores.
Quantifying stall impact on instruction-per-cycle (IPC)
IPC = instructions retired / cycles elapsed. A core with a theoretical peak IPC of 1.0 but 20% of cycles lost to stalls delivers an effective IPC of 0.8. Measuring actual stall sources — cache misses vs. branch flushes vs. load-use hazards — requires breaking total cycles into busy cycles and attributed stall cycles, which hardware performance counters on Cortex-A (and some Cortex-M variants) expose directly.
Optimization Techniques for Pipeline Efficiency
Loop unrolling to reduce data dependencies
Unrolling a loop body multiple times interleaves independent operations from different iterations, giving the pipeline more independent work to overlap instead of stalling on a single dependency chain each iteration. The trade-off is larger code size, which can itself hurt instruction cache hit rate — unroll factors should be chosen empirically, not maximized blindly.
Instruction scheduling across compiler and hardware
Compilers reorder independent instructions to separate a load from its first use, hiding load-use latency. On in-order cores this compiler scheduling is the primary defense against stalls since there's no hardware reordering; on out-of-order cores the hardware can reorder dynamically, but compiler scheduling still helps by giving the reorder window better choices.
Memory access patterns to exploit cache locality
Sequential, cache-line-friendly access patterns (iterating arrays in stride-1 order, structuring data to avoid false sharing) keep the Memory stage hitting in L1 instead of stalling on misses. Random or large-stride access patterns defeat spatial locality and turn every few accesses into an L2 or DRAM round trip.
Avoiding pipeline-draining operations in real-time code
Instructions that force a full pipeline flush — memory barriers, cache maintenance operations, mode switches, some coprocessor instructions — should be used sparingly in latency-critical paths. In an interrupt service routine, each such operation adds directly to worst-case latency, not just average throughput loss.
Pipeline Behavior in Multi-Stage Accelerators
Pipelined datapath design for neural network inference
Dedicated inference accelerators apply the same pipelining principle to convolution and matrix-multiply datapaths: multiply-accumulate units, activation functions, and pooling stages are arranged so that one layer's output stage overlaps with the next input's fetch stage. The MAX78000 CNN accelerator is a concrete example of a purpose-built pipelined datapath that keeps convolution throughput high while running at low clock frequency to save power, trading general-purpose flexibility for a fixed, highly efficient pipeline shape.
Balancing stage depths for heterogeneous operations
Unlike a CPU where most instructions do comparable work per stage, accelerator pipelines mix cheap operations (accumulation) with expensive ones (nonlinear activation, pooling reduction). Balancing stage depth means splitting the expensive stage across multiple pipeline steps so no single stage becomes the throughput bottleneck — an unbalanced design runs at the speed of its slowest stage no matter how fast the others are.
Throughput scaling with pipeline length
Adding pipeline stages generally increases achievable clock frequency and therefore throughput, up to the point where control overhead, forwarding complexity, and flush penalties on hazards outweigh the per-stage speed gain. Accelerator designers choose depth based on the expected hazard rate in the dataflow — convolution pipelines have very regular, predictable dataflow with few hazards, which is why they can be pipelined far deeper than general-purpose CPU pipelines without suffering proportional stall penalties.
Measuring Pipeline Performance Impact
Cycle accounting and stall attribution
Effective pipeline tuning starts with knowing where cycles go: busy cycles, cache-miss stall cycles, branch-flush cycles, and load-use stall cycles. Hardware event counters (cycle count, instruction count, cache miss count, branch mispredict count) are the raw inputs; attributing them correctly requires knowing the pipeline's specific stall behavior from the core's technical reference manual.
Profiling tools for embedded pipeline analysis
Vendor toolchains typically expose these counters through a debug probe or trace unit (e.g., ARM's Embedded Trace Macrocell/ETM with a compatible analyzer). Sampling-based profilers built on the Performance Monitoring Unit (PMU) can correlate stall cycles back to source lines, which is far more actionable than a flat cycle-count total.
Relating pipeline efficiency to MIPS and CoreMark metrics
Headline throughput numbers like MIPS, CoreMark, and DMIPS are aggregate outcomes of pipeline efficiency under a specific benchmark's instruction mix and memory access pattern — they are not independent of the hazards discussed above. A core with excellent peak IPC but poor branch prediction can still score lower on CoreMark than its clock frequency suggests, because CoreMark's control flow and data access patterns expose exactly the stalls this article describes. When comparing cores, treat these benchmark numbers as a starting point for pipeline investigation, not a substitute for it.
Learning
Sign in to track your progress.
Evidence
Public projects engineers linked to Pipeline Stages: Fetch, Decode, Execute, Memory, Write-Back.
No engineer has linked a project to this topic yet. Built something that proves it? Add the project and tag it with embedded-systems-pipeline-stages-fetch-decode-execute-memory-write- — it then shows here and on your public profile.