
Blood Glucose Reference Range: Fasting, Postprandial, HbA1c
Blood glucose reference ranges for fasting, postprandial, and HbA1c explained with sensor accuracy, lag, and calibration implications.
Contents & prerequisites
Why Blood Glucose Ranges Matter for Device Engineers
A glucose monitoring device is only as useful as its ability to report a number that a clinician or a closed-loop algorithm can act on with confidence. Unlike many physiological signals where "close enough" is acceptable, glucose management decisions — insulin dosing, hypoglycemia alarms, meal bolus calculations — are driven by thresholds that are narrow in absolute terms. A 15 mg/dL error near the hypoglycemia boundary can mean the difference between a correct alarm and a missed one, or a nuisance alarm that erodes patient trust in the device.
Clinical decision thresholds and device accuracy requirements
Clinical practice defines glucose status using hard numeric cutoffs: fasting plasma glucose, 2-hour postprandial glucose, and HbA1c percentage. Each cutoff was established from population outcome data (retinopathy risk, cardiovascular risk, etc.), not from sensor engineering convenience. That means your device's accuracy specification must be tight enough that measurement error doesn't shift a patient across a diagnostic or therapeutic boundary. If the clinical threshold for hypoglycemia treatment is 70 mg/dL, a sensor with ±15% error (a typical CGM specification point) introduces real ambiguity in the 60–80 mg/dL band — precisely where treatment decisions are made.
Regulatory expectations for glucose monitoring systems
Standards and regulators (ISO 15197 for self-monitoring blood glucose meters, FDA's own SMBG guidance in the US, and the FDA iCGM special controls for continuous monitors) specify accuracy as the percentage of readings within a tolerance band of a reference lab method, stratified by glucose concentration. Designers should treat the applicable standard document as the primary accuracy spec, not a rough target — in ISO 15197, for example, the tolerance switches from ±15 mg/dL below 100 mg/dL to ±15% at or above it, and the reference method itself (YSI analyzer, hexokinase assay) has its own small error budget that eats into your allowable margin.
Real-world variability and individual patient factors
Reference ranges describe population norms, but an individual's glucose trajectory is shaped by medication, renal function, hematologic conditions, and sensor placement. A device calibrated purely to population-average kinetics will systematically misjudge certain patients — hence the push toward adaptive calibration and patient-specific drift models rather than static factory curves.
Fasting Blood Glucose (FBG): Definition and Reference Range
Normal fasting glucose range and physiological basis
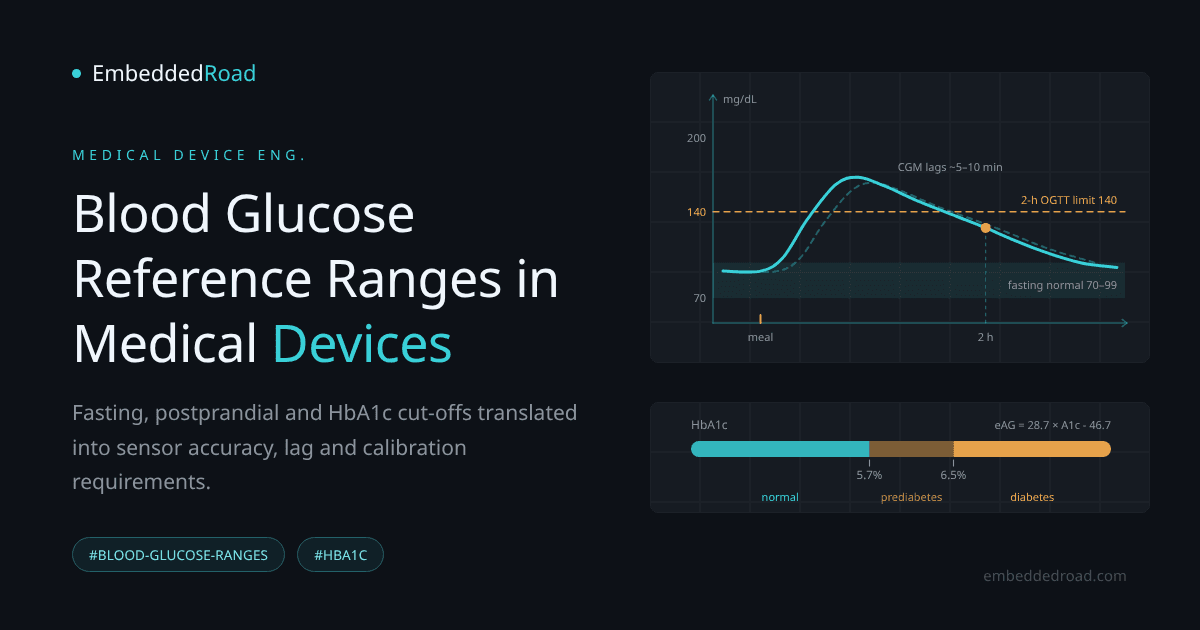
Fasting plasma glucose is measured after at least 8 hours without caloric intake. In a healthy adult, hepatic glucose output and peripheral uptake balance to hold plasma glucose between roughly 70 and 99 mg/dL (3.9–5.5 mmol/L). This steady state reflects basal insulin secretion suppressing hepatic gluconeogenesis just enough to match the brain's continuous glucose demand (~4–5 g/hour) without over-suppressing it into hypoglycemia.
Impaired fasting glucose (IFG) classification
Values from 100–125 mg/dL (5.6–6.9 mmol/L) are classified as impaired fasting glucose, a prediabetic state. At or above 126 mg/dL on two separate occasions meets the diagnostic criterion for diabetes. These boundaries are the ones your firmware's reporting layer must reproduce exactly — rounding behavior at 99 vs. 100 mg/dL is not cosmetic, it changes a patient's classification.
Device calibration and timing considerations for fasting state
Fasting measurement is the easiest condition for a sensor to get right because the physiological signal is relatively flat — rate of change is typically under 1 mg/dL/min. This makes the fasting state the natural window for single-point or two-point calibration of a continuous sensor against a reference meter, since lag artifacts (discussed below) are minimized when the underlying signal isn't moving quickly.
Postprandial Blood Glucose: Peak Response and Clinical Significance
Two-hour postprandial glucose testing protocol
Standard postprandial testing measures plasma glucose 2 hours after the start of a meal (or after a standardized 75 g oral glucose load in an OGTT). This window captures the peak-and-decline shape of the insulin response rather than the transient spike that occurs at 30–60 minutes.
Normal vs. impaired postprandial response ranges
On a 75 g OGTT, a 2-hour value under 140 mg/dL (7.8 mmol/L) is normal; 140–199 mg/dL (7.8–11.0 mmol/L) is impaired glucose tolerance; 200 mg/dL (11.1 mmol/L) or above meets the OGTT diagnostic threshold for diabetes. The peak itself, usually reached between 30 and 90 minutes post-meal, can be considerably higher than the 2-hour value and is where most hyperglycemic excursions actually occur — a fact closed-loop systems must account for even though the formal diagnostic test ignores the peak.
Sensor response time and lag compensation in continuous monitors
This is where device engineering diverges sharply from lab chemistry. Continuous glucose monitors (CGMs) measure interstitial fluid glucose, which lags blood glucose by a physiological transport delay typically cited as 5–10 minutes, plus additional sensor-electronics lag from the diffusion membrane and signal filtering. During a rapid postprandial rise (glucose can climb at 2–4 mg/dL/min in some individuals), a 10-minute lag can produce a reported value 20–40 mg/dL below the true blood concentration. Algorithm designers compensate with derivative-based prediction (Kalman filtering or similar state estimators) that extrapolate the interstitial signal forward, but overly aggressive compensation introduces noise amplification and false hypoglycemia predictions during sudden deceleration. Any lag-compensation filter should be validated against a glucose clamp or rapid-OGTT dataset specifically designed to exercise high dG/dt, not just steady-state accuracy.
HbA1c: Long-Term Glucose Control and Averaging
Hemoglobin glycation mechanism and 2–3 month window
Glucose nonenzymatically binds to the N-terminal valine of the hemoglobin beta chain, forming HbA1c at a rate proportional to ambient glucose concentration. Because red blood cells live roughly 120 days, the HbA1c percentage measured at any moment reflects a glucose-exposure-weighted average over the preceding 2–3 months, with the most recent 30 days contributing disproportionately due to the cell population's age distribution.
HbA1c reference ranges and diagnostic thresholds
Normal HbA1c is below 5.7%. Prediabetes is defined as 5.7–6.4%. Diabetes is diagnosed at 6.5% or above. These cut-offs come from epidemiological data linking glycemia to retinopathy risk, the same evidence base behind the FBG and 2-hour cut-offs, while the DCCT and UKPDS trials established HbA1c as the reference marker for treatment targets. The three metrics are meant to be read together, not as independent axes.
Relationship between HbA1c and mean blood glucose
The widely used linear approximation is:
Estimated Average Glucose (mg/dL) = 28.7 × HbA1c(%) − 46.7
So an HbA1c of 7.0% corresponds to an estimated average glucose of about 154 mg/dL. This formula (from the ADAG study) is a population regression, not a patient-specific transfer function — individual red cell turnover rate, anemia, and hemoglobinopathies shift the real relationship, which matters if your device tries to back-calculate an "estimated A1c" from CGM trend data for display purposes.
Laboratory measurement vs. point-of-care device performance
Lab HbA1c assays (HPLC, immunoassay) are standardized under NGSP/IFCC traceability protocols. Point-of-care HbA1c analyzers must demonstrate agreement with this reference within defined bias and precision limits — check the specific certification document before claiming lab-equivalent HbA1c on a point-of-care product, since POC devices are more susceptible to hematocrit and temperature interference than central lab instruments.
Physiological Factors Affecting Glucose Levels
Hormonal regulation: insulin, glucagon, and cortisol
Glucose homeostasis is a negative feedback system: insulin from pancreatic beta cells lowers plasma glucose by promoting cellular uptake and suppressing hepatic output; glucagon from alpha cells raises it by stimulating glycogenolysis and gluconeogenesis. Cortisol and growth hormone act as longer-timescale counter-regulatory hormones, raising baseline glucose during stress or illness. A device's alarm logic should recognize that counter-regulatory hormone surges (e.g., the dawn phenomenon driven by early-morning growth hormone and cortisol release) produce predictable glucose rises that are not sensor error.
Role of the autonomic nervous system in glucose homeostasis
Sympathetic activation (fight-or-flight) suppresses insulin secretion and stimulates glucagon and hepatic glucose output, while parasympathetic (vagal) tone supports insulin release during rest and digestion. This means a patient's autonomic state at the moment of measurement is itself a confound — a stress response can elevate glucose independent of recent food intake. For engineers building multi-signal physiological monitors, understanding how to detect and separate these states is covered in Autonomic Nervous System: Sympathetic and Parasympathetic Indicators; cross-referencing heart rate variability with glucose trend data can help a device flag a stress-driven excursion rather than a true metabolic one.
Impact of stress, exercise, and circadian rhythm on measurements
Acute exercise can either lower glucose (via insulin-independent GLUT4 translocation) or raise it transiently (via catecholamine-driven hepatic output), depending on intensity and duration. Circadian rhythm alone shifts fasting glucose by several mg/dL across the day due to cortisol cycling. None of this is sensor artifact, but all of it must be distinguishable from artifact in your signal processing pipeline, or you will chase noise that is actually physiology.
Device Design Considerations for Glucose Measurement
Electrochemical and enzymatic sensor principles
The dominant technology, both in strip-based meters and CGMs, uses glucose oxidase or glucose dehydrogenase immobilized at an electrode. The enzyme converts glucose to gluconolactone while generating a measurable electron transfer, either through a mediator or via a diffusion-limited oxygen/hydrogen-peroxide pathway. Current output is proportional to glucose flux to the electrode, which is itself diffusion-limited by a semipermeable membrane — the membrane is what sets both the sensor's linear range and its intrinsic time constant.
Sampling site effects (finger-stick vs. interstitial fluid)
Finger-stick capillary blood tracks arterial glucose closely with minimal lag. Interstitial fluid, sampled by subcutaneous CGM sensors, introduces the transport delay discussed earlier and is also subject to local perfusion differences — compression during sleep, or vasoconstriction during cold exposure, can alter local diffusion independent of systemic glucose. Alternative sampling sites (forearm, abdomen) have their own published lag and bias characteristics; these should be pulled from the specific product's clinical validation study rather than assumed to match finger-stick behavior.
Calibration frequency and drift compensation
Enzymatic sensors drift due to membrane fouling, enzyme degradation, and biofilm formation at the implant site. Older CGM generations required twice-daily fingerstick calibration; factory-calibrated sensors now rely on pre-characterized lot-level sensitivity curves plus in-vivo drift models that adjust gain over the sensor's wear period. Any drift-compensation algorithm needs a defined behavior for the end-of-life period, where membrane degradation accelerates and confidence intervals on the reported value should widen rather than silently hold the prior calibration.
Clinical accuracy standards and performance targets
Consensus accuracy metrics for glucose devices include Mean Absolute Relative Difference (MARD) and Clarke/Parkes error grid placement, which weights errors by clinical consequence rather than pure magnitude — a 20 mg/dL error at 300 mg/dL is clinically trivial, the same error at 60 mg/dL is dangerous. Design targets should be pulled from the specific regulatory submission pathway (510(k) predicate performance, or the applicable ISO/IEC standard for the device class) rather than a generic MARD number, since acceptable MARD differs between self-monitoring meters and continuous sensors.
For engineers exploring sensor technology earlier in development, in-vitro tissue models used to characterize enzymatic sensor response under controlled perfusion conditions are discussed in Organ-on-Chip: Microfluidic Cell Culture and Biosensing, an approach that can help characterize glucose sensor membranes under realistic interstitial flow and shear before animal or human studies.
Practical Application in Diabetes Management Systems
Integration of fasting, postprandial, and HbA1c data in closed-loop systems
A well-designed closed-loop insulin delivery system doesn't treat these three metrics as independent readouts — it uses CGM trend data continuously for dosing decisions, uses fasting-state readings as the most reliable calibration anchor, and uses periodic HbA1c (entered manually or imported from lab records) as a long-term consistency check against the device's own running average. A persistent mismatch between device-reported average glucose and lab HbA1c is a strong signal of sensor bias, patient non-wear time, or a hematologic confound, and should trigger a service flag rather than be silently absorbed into the algorithm.
Alarm thresholds and hypoglycemia/hyperglycemia detection
Typical alarm defaults sit near 70 mg/dL for low glucose and somewhere in the 180–250 mg/dL range for high glucose, but these should be configurable per clinical guidance, and predictive alarms (projected to cross threshold within 15–30 minutes based on current rate of change) need their own validated false-alarm rate — overly sensitive predictive alarms cause alarm fatigue, which is itself a documented patient safety failure mode.
Data logging and trend analysis for patient and clinician review
Standard reporting formats (Ambulatory Glucose Profile) aggregate time-in-range, time-below-range, and time-above-range against the same clinical bands described above (70–180 mg/dL as the primary target range in most guidelines). Device logging architecture should preserve raw sensor current and applied calibration metadata, not just the final displayed glucose value, so that post-hoc clinical review or recall investigation can distinguish a sensor fault from a true physiological event.
Learning
Sign in to track your progress.
Evidence
Public projects engineers linked to Blood Glucose Reference Range: Fasting, Postprandial, HbA1c.
No engineer has linked a project to this topic yet. Built something that proves it? Add the project and tag it with medical-devices-blood-glucose-reference-range-fasting-postprandial — it then shows here and on your public profile.