
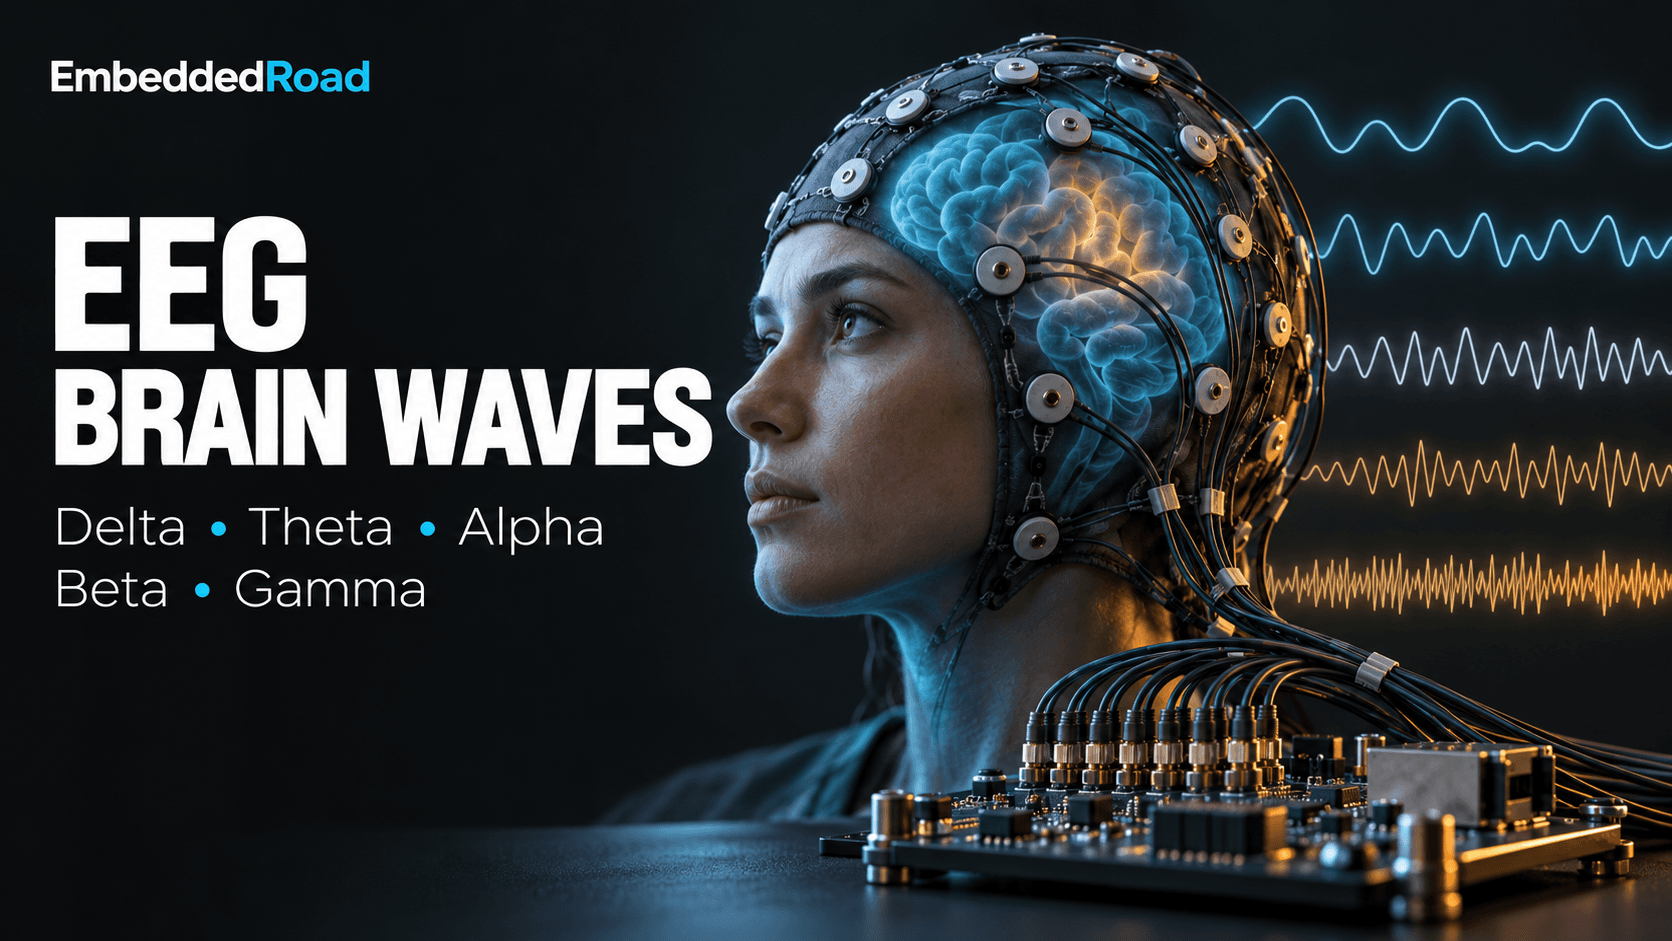
Brain Waves: Delta, Theta, Alpha, Beta, Gamma EEG Bands
Understand EEG frequency bands (delta, theta, alpha, beta, gamma) and the filtering, artifact rejection, and spectral methods to extract them reliably.
Contents & prerequisites
What are brain waves and why do they matter in medical devices?
Brain waves are rhythmic voltage fluctuations, on the order of 1–100 µV at the scalp, produced by synchronized post-synaptic currents in populations of cortical neurons. An electroencephalogram (EEG) system measures these fluctuations through surface electrodes and decomposes them into frequency bands because the dominant frequency of cortical synchrony correlates strongly with the underlying brain state — arousal level, cognitive load, anesthetic depth, or pathology.
Neural oscillations as biomarkers
A neural oscillation becomes a clinical biomarker when its power in a defined frequency band changes in a reproducible, state-dependent way. Delta, theta, alpha, beta, and gamma bands are not arbitrary engineering filter bins — they map onto distinct thalamocortical and cortico-cortical circuits with different conduction delays and synaptic time constants. For a device engineer, this means the bands are a fixed target: your acquisition chain must preserve amplitude and phase relationships across 0.5–100 Hz without inventing energy in adjacent bands through filter artifacts.
Why frequency bands are clinically relevant
Clinicians read band power ratios, not raw waveforms, because absolute EEG amplitude varies with skull thickness, electrode impedance, and scalp hydration, while relative band power is comparatively stable within a patient. A device that reports "alpha power dropped 40%" is making a claim about spectral ratios computed over a defined epoch, typically 1–10 seconds, and that computation is only as trustworthy as the filtering and artifact rejection upstream of it.
Role of EEG in diagnostic and monitoring systems
EEG band classification underlies sleep staging, anesthesia depth indices, seizure detection algorithms, and brain-computer interfaces. Unlike imaging modalities such as those described in MRI Physics: Proton Spin, Larmor Frequency, T1/T2 Relaxation, EEG gives millisecond temporal resolution but poor spatial localization — a trade-off that shapes every downstream design decision, from electrode count to montage choice.
How are the five EEG frequency bands defined?
Delta (0.5–4 Hz): definition and characteristics
Delta waves have the highest amplitude of any band, often 20–200 µV, and reflect slow cortical up-down states generated largely by thalamocortical loops. Below 0.5 Hz the signal merges into DC drift and electrode polarization artifact, which is why 0.5 Hz is treated as a hard high-pass boundary rather than a clinical one.
Theta (4–8 Hz): definition and characteristics
Theta waves sit between delta and alpha, with typical amplitudes of 10–50 µV, and are associated with hippocampal-cortical interaction. In adults, sustained theta over frontal-midline electrodes during wakefulness is often abnormal, whereas the same frequency is normal and expected in children.
Alpha (8–12 Hz): definition and characteristics
Alpha waves are the classic posterior-dominant rhythm, 20–60 µV, that emerges over occipital-parietal electrodes when the eyes close and attention relaxes. Alpha is the band most engineers meet first because it gives an easy functional test: a clean alpha blocking response (amplitude drop) on eye opening confirms electrode and amplifier integrity.
Beta (12–30 Hz): definition and characteristics
Beta waves are lower amplitude, typically 5–20 µV, and dominate frontal-central electrodes during active concentration, motor planning, and anxiety. Beta also increases under many sedative and benzodiazepine drug effects, which complicates its use as a pure "alertness" marker in perioperative monitoring.
Gamma (30–100 Hz): definition and characteristics
Gamma waves are the lowest amplitude band, often under 10 µV, and are linked to feature binding and high-level integration across cortical regions. Gamma is also the band most vulnerable to contamination, since scalp muscle (electromyographic, EMG) activity overlaps 20–100 Hz with comparable or greater amplitude than genuine cortical gamma.
Which brain states produce which EEG bands?
Delta dominance during deep sleep and anesthesia
Delta power dominates during slow-wave sleep (polysomnography stage N3) and during surgical planes of general anesthesia, reflecting cortical disengagement from sensory input. This is the direct answer to "which brain wave is associated with deep sleep": delta, 0.5–4 Hz, is the defining band of stage N3 and of deep anesthetic unconsciousness.
Theta during drowsiness, meditation, and light sleep
Theta rises during the drowsy transition into stage N1 sleep and during deep meditative states in experienced practitioners. The distinction clinicians care about is this: theta reflects a transitional, reduced-arousal state, while alpha reflects relaxed but still fully conscious wakefulness — that is the core theta-versus-alpha difference an engineer needs to encode in any state-classification logic.
Alpha during relaxed wakefulness and eyes closed
Alpha is strongest with eyes closed and mental relaxation, and attenuates ("blocks") within roughly 1 second of eye opening or an alerting stimulus. This reactivity test is a standard quality-control step built into clinical EEG protocols and is worth replicating in any new device as a go/no-go signal-integrity check.
Beta during active thinking and concentration
Beta dominates during active problem-solving, motor execution, and states of anxiety or hyperarousal. Elevated beta is also a known confound in patients on benzodiazepines, so any beta-based alertness index needs a drug-history flag or it will misclassify a sedated-but-anxious patient as awake.
Gamma during high-level cognitive processing
Gamma bursts correlate with working memory load and cross-modal sensory binding, but because of its small amplitude and overlap with EMG, gamma is the band least suited to single-channel consumer devices and most dependent on dense electrode arrays with good scalp contact.
How do clinicians interpret abnormal EEG band patterns?
Seizure detection and epilepsy classification
Seizure detection algorithms look for sudden, sustained increases in rhythmic power with a characteristic evolving frequency — often starting in beta or gamma and slowing as the seizure progresses — combined with spatial spread across electrodes. A practical seizure-detection pipeline computes short-time band power (1–2 second epochs, 50% overlap) per channel, applies a spike/sharp-wave morphology detector in parallel, and flags an event only when both rhythmic-power and morphology criteria exceed threshold for a minimum duration, typically 10 seconds, to suppress single-epoch false positives from artifact.
Sleep stage identification (polysomnography)
Polysomnography scoring (per AASM — American Academy of Sleep Medicine — criteria) uses delta dominance for N3, theta for N1, spindle/K-complex morphology for N2, and mixed-frequency low-amplitude activity for REM sleep, always combined with EOG (electrooculogram) and EMG channels since band power alone cannot separate REM from wake.
Pathological theta and delta in encephalopathy
Diffuse slowing — excess theta and delta in an awake patient — is a nonspecific but sensitive marker of metabolic encephalopathy, hypoxia, or diffuse structural injury, and is frequently correlated against intracranial pressure trends; see Intracranial Pressure (ICP): Normal Range, Monitoring for how ICP elevation itself produces secondary EEG slowing in neurocritical care.
Reduced alpha as marker of cognitive decline
Reduced posterior alpha power, and a slowing of peak alpha frequency from the healthy 10 Hz toward 8 Hz, is a replicated finding in Alzheimer's disease and related dementias, answering the question of whether EEG bands can predict cognitive decline: they offer a supportive, not diagnostic, biomarker, typically combined with cognitive testing and structural imaging rather than used alone.
Asymmetry and focal abnormalities
Interhemispheric amplitude or frequency asymmetry greater than roughly 50% between homologous electrodes suggests a focal lesion, and persistent focal delta ("delta focus") over an otherwise normal background is a classic sign of underlying structural pathology such as tumor or prior infarct.
What signal acquisition and processing challenges arise in EEG band measurement?
Electrode placement and montage standards
The 10-20 system (and its denser 10-10 extension) standardizes electrode placement as percentages of skull landmark distances, ensuring montages are comparable across patients and institutions. Device designers choosing a reduced electrode set for a wearable must document which 10-20 sites are sacrificed and validate that the target band's spatial distribution survives the reduction — posterior alpha tolerates fewer channels far better than focal seizure localization does.
Artifact rejection (muscle, eye movement, 50/60 Hz noise)
Four artifact sources dominate practical EEG: ocular (blinks and saccades, 0.1–10 Hz, high amplitude at frontal sites), myogenic (EMG, 20–100 Hz, overlapping beta/gamma), mains interference (50 Hz or 60 Hz plus harmonics), and motion/electrode-pop transients.
| Artifact | Frequency overlap | Typical mitigation |
|---|---|---|
| Eye blink/movement | 0.1–10 Hz | Dedicated EOG channel, regression or ICA removal |
| Muscle (EMG) | 20–100 Hz | High-frequency amplitude threshold reject, spatial filtering |
| Mains hum | 50/60 Hz ± harmonics | Notch filter, shielded cabling, driven-right-leg reference |
| Electrode pop/motion | Broadband transient | Impedance monitoring, epoch rejection on slew-rate threshold |
Independent component analysis (ICA) is the standard offline tool for separating ocular and muscle components from genuine cortical sources, but it requires enough channels (practically 16 or more) and enough clean data to converge reliably, which rules it out for low-channel real-time wearables.
Spectral analysis methods (FFT, wavelet decomposition)
The Fast Fourier Transform (FFT) over a windowed epoch (commonly Hamming or Hann window, 1–4 second length) gives band power with frequency resolution equal to the inverse of the window length — a 2-second window yields 0.5 Hz bins, adequate for delta/theta/alpha separation but marginal for resolving narrow gamma sub-bands. Wavelet decomposition trades fixed frequency resolution for better time localization at high frequencies, which is preferable for transient events like spindles or epileptiform spikes where the FFT's fixed window blurs onset timing.
Filtering and bandwidth trade-offs
A typical clinical EEG front end high-pass filters at 0.5–1 Hz to remove DC drift and electrode polarization, and low-pass filters at 70–100 Hz (with a mains notch) to limit EMG and interference while preserving gamma. Steep digital filters (high-order IIR) introduce group delay and ringing near the cutoff that can distort delta and low-theta morphology, so clinical systems generally prefer linear-phase FIR filters or carefully characterized lower-order IIR designs, accepting the extra computational cost.
Real-time vs. post-processing constraints
Real-time systems — seizure alarms, anesthesia depth monitors, BCIs — must compute band power within a bounded latency, often under 1–2 seconds, which forces short FFT windows and accepts coarser frequency resolution; offline systems scoring overnight polysomnography can use longer windows and iterative artifact-cleaning passes that would be unacceptable in a closed-loop alarm.
Which medical device applications rely on EEG band classification?
Brain-computer interfaces (BCIs) and neurofeedback
BCIs commonly use alpha and beta power changes over motor cortex (sensorimotor rhythm, 8–30 Hz) as a control signal for cursor movement or device actuation, and neurofeedback systems train patients to volitionally shift band ratios, for example increasing frontal beta relative to theta in attention-deficit protocols.
Sleep monitoring systems and diagnostic devices
Consumer and clinical sleep devices classify stages from delta/theta/alpha ratios combined with movement data, with clinical-grade polysomnography requiring full 10-20 montage plus EOG/EMG, while consumer wearables accept reduced accuracy for a single forehead channel.
Anesthesia depth monitors during surgery
Commercial depth-of-anesthesia indices compute a composite score from relative beta, alpha, and delta power (plus burst-suppression detection at very deep levels) to give anesthesiologists a single trending number; the underlying algorithm specifics are proprietary and should be checked against the manufacturer's clinical validation document rather than assumed from band theory alone.
Seizure prediction and warning systems
Seizure prediction extends detection by looking for pre-ictal spectral trends — often a gradual beta/gamma rise or a shift in band power ratios minutes before electrographic onset — though prediction horizons and false-alarm rates vary widely by algorithm and patient population and must be validated per device, not assumed generic.
Cognitive load and fatigue detection
Workload-monitoring systems track theta/alpha ratio increases and beta decreases as proxies for mental fatigue in applications like driver monitoring, generally cross-checked against a secondary physiological channel because single-band thresholds drift with electrode impedance over a multi-hour session.
How do EEG bands integrate with other physiological monitoring?
Correlation with autonomic nervous system markers
EEG arousal markers correlate with autonomic signals such as electrodermal activity; see Galvanic Skin Response (GSR): Sympathetic Nervous Indicator for how sympathetic tone tracked via skin conductance complements beta/gamma-based arousal estimates when EEG alone is ambiguous, for instance during motion artifact.
Combined monitoring in ICU and OR settings
Intensive-care and operating-room systems increasingly fuse EEG band trends with ICP, blood pressure, and capnography to build a composite neurological status picture, since any single channel — including EEG — can be artifact-corrupted at exactly the moment a clinical decision is needed.
Multimodal assessment in neurocritical care
In neurocritical care, continuous EEG slowing is interpreted alongside ICP trends and imaging findings rather than in isolation, because delta/theta elevation is sensitive to many insults (hypoxia, mass effect, metabolic derangement) but not specific to any one of them, and multimodal correlation is what turns a nonspecific band shift into an actionable clinical signal.
Learning
Sign in to track your progress.
Evidence
Public projects engineers linked to Brain Waves: Delta, Theta, Alpha, Beta, Gamma EEG Bands.
No engineer has linked a project to this topic yet. Built something that proves it? Add the project and tag it with medical-devices-brain-waves-delta-theta-alpha-beta-gamma-eeg-bands — it then shows here and on your public profile.