
Cardiac Cycle: Systole, Diastole, Stroke Volume, Cardiac Output
Understand cardiac cycle mechanics—systole, diastole, stroke volume, and cardiac output—to design pacemaker, ICD, and monitoring algorithms.
Contents & prerequisites
Overview of the Cardiac Cycle
Definition and duration
The cardiac cycle is the complete sequence of mechanical events — contraction, ejection, relaxation, filling — that occurs in one heartbeat. At a resting heart rate of 70–75 bpm, one cycle lasts roughly 800 ms. Of that, systole (contraction and ejection) occupies about 300 ms and diastole (relaxation and filling) occupies about 500 ms. This asymmetry matters: as heart rate increases, nearly all of the shortening comes out of diastole, not systole. A device that assumes a fixed systolic/diastolic ratio across heart rates will mistime its interventions at tachycardia.
Clinical relevance for device design
Every implantable or wearable cardiac device — pacemaker, ICD, CRT device, hemodynamic monitor, balloon pump, VAD controller — is ultimately a machine that must act at the right phase of this cycle. Pace a ventricle during its own refractory period and nothing happens; shock during the vulnerable window of the T-wave and you can induce the arrhythmia you were trying to prevent; inflate an intra-aortic balloon during systole instead of diastole and you increase afterload instead of improving coronary perfusion. The electrical events described in the cardiac action potential and propagated by the conduction system trigger the mechanical cycle covered here, but electrical and mechanical events are not simultaneous — there's an electromechanical delay on the order of 30–50 ms that any closed-loop control algorithm must account for.
Phases and timeline in a typical heartbeat
For a resting adult, a reasonable phase breakdown is:
| Phase | Duration | Key event |
|---|---|---|
| Isovolumetric contraction | ~50 ms | Mitral/tricuspid valves close, pressure rises, volume constant |
| Ventricular ejection | ~250 ms | Aortic/pulmonic valves open, blood ejected |
| Isovolumetric relaxation | ~80 ms | Semilunar valves close, pressure falls, volume constant |
| Rapid + diastasis filling | ~300–400 ms | AV valves open, passive filling |
| Atrial contraction (atrial kick) | ~100 ms | Final ~20% of filling |
These numbers are approximate physiological values for reference design assumptions, not a substitute for the timing tables in a clinical hemodynamics reference — verify against a validated source (e.g., Guyton & Hall or a clinical electrophysiology text) before encoding thresholds into firmware.
Systole: Ventricular Contraction
Isovolumetric contraction phase
Once the ventricle depolarizes and tension develops, ventricular pressure exceeds atrial pressure and the mitral/tricuspid valves snap shut (generating S1). But ventricular pressure hasn't yet exceeded aortic/pulmonic pressure, so the semilunar valves stay shut too. All four valves are closed, volume is fixed, and pressure rises steeply. This is the phase an engineer designing an intracardiac pressure sensor needs to recognize as a near-vertical dP/dt segment — it's also the basis of the dP/dt_max metric used to assess contractility in some hemodynamic monitors.
Ventricular ejection phase
When left ventricular pressure exceeds aortic pressure (roughly 80 mmHg), the aortic valve opens and blood is ejected. Ejection is not constant-flow — it rises to a peak in early systole then tails off as ventricular pressure falls below aortic pressure, at which point the aortic valve closes (S2). Peak aortic pressure here is what defines the systolic reading discussed in Blood Pressure: Systolic, Diastolic, Pulse Pressure, MAP — the cardiac cycle is the upstream mechanical cause of that waveform, not a separate phenomenon.
Pressure and volume changes during systole
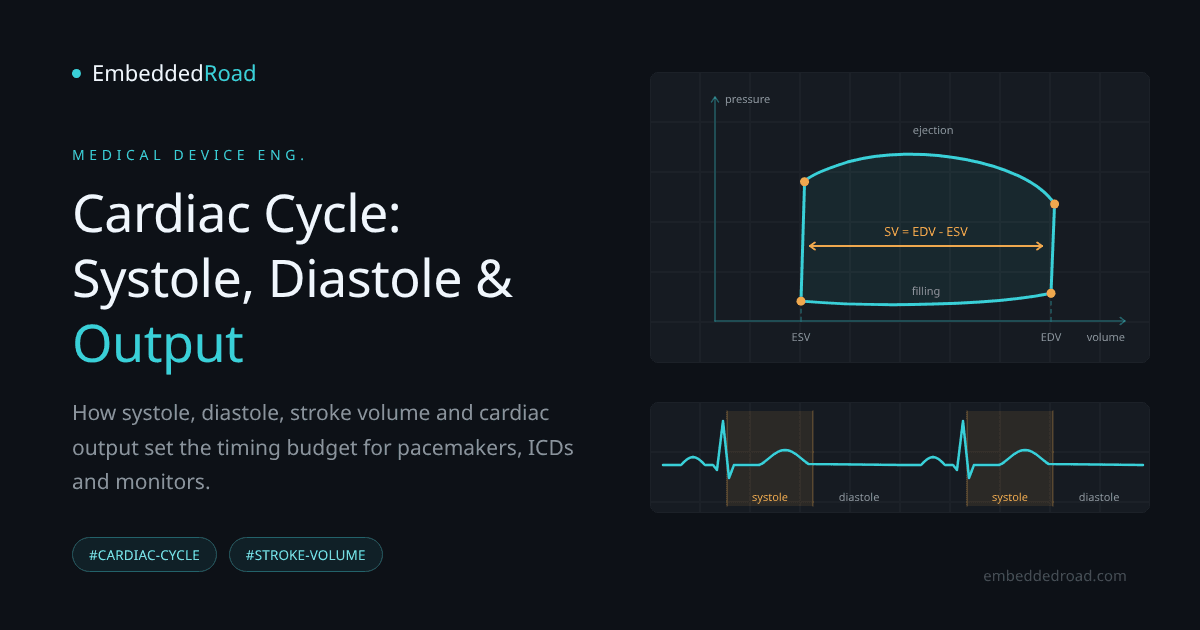
Ventricular volume stays constant during isovolumetric contraction, then falls steadily through ejection as the stroke volume leaves the chamber. Pressure rises through both sub-phases until peak systolic pressure, then falls. Plotted against each other, these form the right-hand (isovolumetric contraction) and top (ejection) segments of the pressure-volume (PV) loop — a tool worth building into any simulation or bench-test rig for valve or VAD devices, since it decouples timing artifacts from the actual mechanical work being done by the ventricle.
Relationship to electrical activation
Systole is mechanically triggered by the QRS complex, but with a delay. The electromechanical delay and the fact that mechanical systole continues well past the QRS (ejection ends near the end of the T wave) both matter for ICD designers: shocks must be synchronized to the R wave so they never land in the vulnerable period on the T wave, and hemodynamic sensors (impedance, pressure) will always lag the ECG trigger by a predictable but nonzero interval that must be budgeted into blanking and detection windows.
Diastole: Ventricular Relaxation and Filling
Isovolumetric relaxation phase
After the semilunar valves close, ventricular pressure drops rapidly while volume remains fixed — mirroring isovolumetric contraction but in reverse. This phase is brief (roughly 80 ms) but hemodynamically important: the rate of pressure fall (negative dP/dt) is a clinical marker of lusitropy (relaxation function), relevant to diastolic heart failure monitoring.
Passive and active ventricular filling
Once ventricular pressure drops below atrial pressure, the AV valves open and blood flows passively down the pressure gradient — rapid filling — followed by a slower phase called diastasis as pressures equalize. At higher heart rates, diastasis shortens first and can disappear entirely, which is why tachycardia reduces filling time before it reduces anything else.
Atrial contribution and the atrial kick
The atria contract near the end of diastole, contributing roughly 15–25% of end-diastolic volume in a healthy heart — more in a stiff, noncompliant ventricle. This "atrial kick" depends on AV synchrony, which is precisely what dual-chamber pacemakers are designed to preserve. Loss of atrial kick (e.g., in atrial fibrillation, or a single-chamber-paced rhythm with AV dyssynchrony) can drop cardiac output by 15–20% even with heart rate and contractility unchanged — a key justification for AV-synchronous pacing modes over ventricular-only pacing in patients who can support it.
Pressure-volume dynamics
Diastole closes the PV loop: ventricular volume rises from end-systolic volume (ESV) back to end-diastolic volume (EDV) at low, slowly rising pressure (the diastolic filling curve), until the next isovolumetric contraction begins. A stiffened, noncompliant ventricle shows a steeper filling curve — higher pressure for the same volume increment — which is the mechanical signature engineers building heart-failure monitors are trying to detect indirectly via impedance or pressure sensors.
Stroke Volume: The Fundamental Measure
Definition and calculation
Stroke volume (SV) is the volume ejected per beat:
SV = EDV - ESV
A typical healthy adult: EDV ≈ 120 mL, ESV ≈ 50 mL, giving SV ≈ 70 mL. Normal resting SV ranges roughly 60–100 mL depending on body size, conditioning, and measurement method (echocardiography, thermodilution, bioimpedance).
End-diastolic volume (EDV) and end-systolic volume (ESV)
EDV reflects preload — how full the ventricle gets before contraction, governed by venous return, atrial kick, and ventricular compliance. ESV reflects how completely the ventricle empties, governed by contractility and afterload. Rising ESV with stable EDV is a red flag for declining contractility, typically tracked on serial echocardiography; implantable heart failure monitors can't measure ESV directly and instead follow filling pressures and impedance surrogates, as described below.
Factors affecting stroke volume
- Preload (Frank-Starling mechanism): more diastolic stretch → more forceful contraction → higher SV, up to a physiological limit.
- Afterload: higher aortic/arterial pressure (see the MAP discussion in the blood pressure article) increases the resistance against which the ventricle ejects, generally lowering SV if contractility is fixed.
- Contractility: inotropic state, affected by sympathetic tone, drugs, and ischemia, changes how much the ventricle empties for a given preload/afterload pair.
- Heart rate at extremes: very fast rates curtail filling time and reduce EDV, which can reduce SV even if contractility is unchanged.
Clinical measurement and monitoring
SV is measured via echocardiographic volumetric tracing, thermodilution (pulmonary artery catheter), pulse contour analysis of the arterial waveform, bioimpedance/bioreactance, or Doppler velocity-time integral across the aortic valve. Each method has different noise characteristics and latency — a bedside pulse-contour SV estimate updates beat-to-beat but drifts with vasomotor tone changes, while thermodilution is more absolute but intermittent and invasive. Device engineers selecting a monitoring modality need to match update rate and drift characteristics to the clinical decision being automated.
Cardiac Output and Hemodynamic Assessment
Cardiac output formula and normal ranges
CO (L/min) = SV (L) × HR (bpm)
Worked example: SV = 70 mL = 0.070 L, HR = 72 bpm → CO = 0.070 × 72 = 5.04 L/min
Normal resting CO for an adult is approximately 4–8 L/min, often normalized to body surface area as the cardiac index (CI), normal range roughly 2.5–4.0 L/min/m².
Relationship between heart rate and stroke volume
CO is a product, not a sum, so the body can defend it by trading HR against SV. Exercise initially raises CO mostly via increased SV (better venous return, stronger contraction), then increasingly via HR as SV plateaus. In heart failure, SV is chronically depressed, and the body compensates with elevated resting HR — a compensation pattern that shows up directly in implantable monitor trend data and is often an earlier warning sign than any single absolute measurement.
Ejection fraction and clinical significance
Ejection fraction (EF) normalizes SV to the size of the chamber:
EF = SV / EDV = (EDV - ESV) / EDV
Normal EF is approximately 55–70%. EF at or below 40% defines heart failure with reduced ejection fraction (HFrEF) in most clinical guidelines — but always confirm the exact cutoffs against current ACC/AHA or ESC guidance documents rather than hardcoding a single threshold, since classification boundaries are periodically revised.
Device monitoring requirements
A device inferring EF or SV indirectly (impedance cardiography, accelerometry, pressure-derived surrogates) needs a sampling rate sufficient to resolve the ~50 ms isovolumetric phases — meaning raw front-end sampling well above 100 Hz even if the reported output is a once-per-beat scalar — plus a timing reference (ECG R-wave) to align mechanical events to the electrical cycle.
Medical Device Implications
Monitoring cardiac cycle parameters in pacemakers and defibrillators
Pacemakers time atrial and ventricular pacing pulses relative to intrinsic conduction events to preserve the AV delay that produces a normal atrial kick. ICDs must keep shocks out of the vulnerable period near the T-wave peak (which falls in late ejection, just before aortic valve closure) by synchronizing them to the R wave, and must blank sensing circuitry during the pacing artifact without missing a genuine arrhythmia in the following cycle.
Echocardiography and imaging system design
Volumetric imaging systems computing EDV/ESV/EF need frame rates adequate to capture end-systole and end-diastole precisely — missing peak/trough timing by even one frame at typical 30–60 fps can shift ESV measurement enough to change an EF calculation by several percentage points, which matters clinically near the EF cut-offs that separate HFrEF, HFmrEF, and HFpEF.
Heart failure monitoring and adaptive algorithms
Implantable hemodynamic monitors (pulmonary artery pressure sensors, intrathoracic impedance) track trends in filling pressure and estimated SV over days to weeks, looking for the pattern of rising filling pressure with falling SV that precedes decompensation — a slower, trend-based analog of the beat-to-beat PV loop.
Sensor placement and signal acquisition considerations
Pressure sensors must be referenced correctly (ventricular vs. atrial vs. arterial) since the cycle produces very different waveforms at each site; impedance electrodes must be positioned to capture ventricular volume change without confounding from respiration or lead motion; accelerometer-based contractility surrogates need isolation from patient motion artifact that can mimic or mask the isovolumetric contraction signature.
Summary and Key Takeaways
Critical parameters for device engineers
Systole lasts ~300 ms, diastole ~500 ms at rest, and that ratio compresses with heart rate. SV = EDV − ESV (normal ~60–100 mL), CO = SV × HR (normal ~4–8 L/min), EF = SV/EDV (normal ~55–70%). Isovolumetric phases are brief, fast-changing, and are where dP/dt-based contractility metrics are extracted.
Integration with other cardiovascular concepts
The cardiac cycle is the mechanical layer sitting between the electrical trigger described in the cardiac action potential and conduction system articles and the arterial pressure waveform described in Blood Pressure: Systolic, Diastolic, Pulse Pressure, MAP. Any device spanning sensing to actuation — pacemaker, ICD, VAD controller, hemodynamic monitor — has to reconcile all three layers, with timing offsets between them that are small in absolute terms but large relative to the tolerances these devices operate under.
Learning
Sign in to track your progress.
Evidence
Public projects engineers linked to Cardiac Cycle: Systole, Diastole, Stroke Volume, Cardiac Output.
No engineer has linked a project to this topic yet. Built something that proves it? Add the project and tag it with medical-devices-cardiac-cycle-systole-diastole-stroke-volume-cardi — it then shows here and on your public profile.