
Program Counter, Stack Pointer, Link Register
Program Counter, Stack Pointer, and Link Register explained: how PC, SP, and LR drive function calls, returns, and Cortex-M exceptions.
Contents & prerequisites
Prerequisites
What Are Special-Purpose Registers?
Why CPUs need dedicated registers beyond general-purpose ones
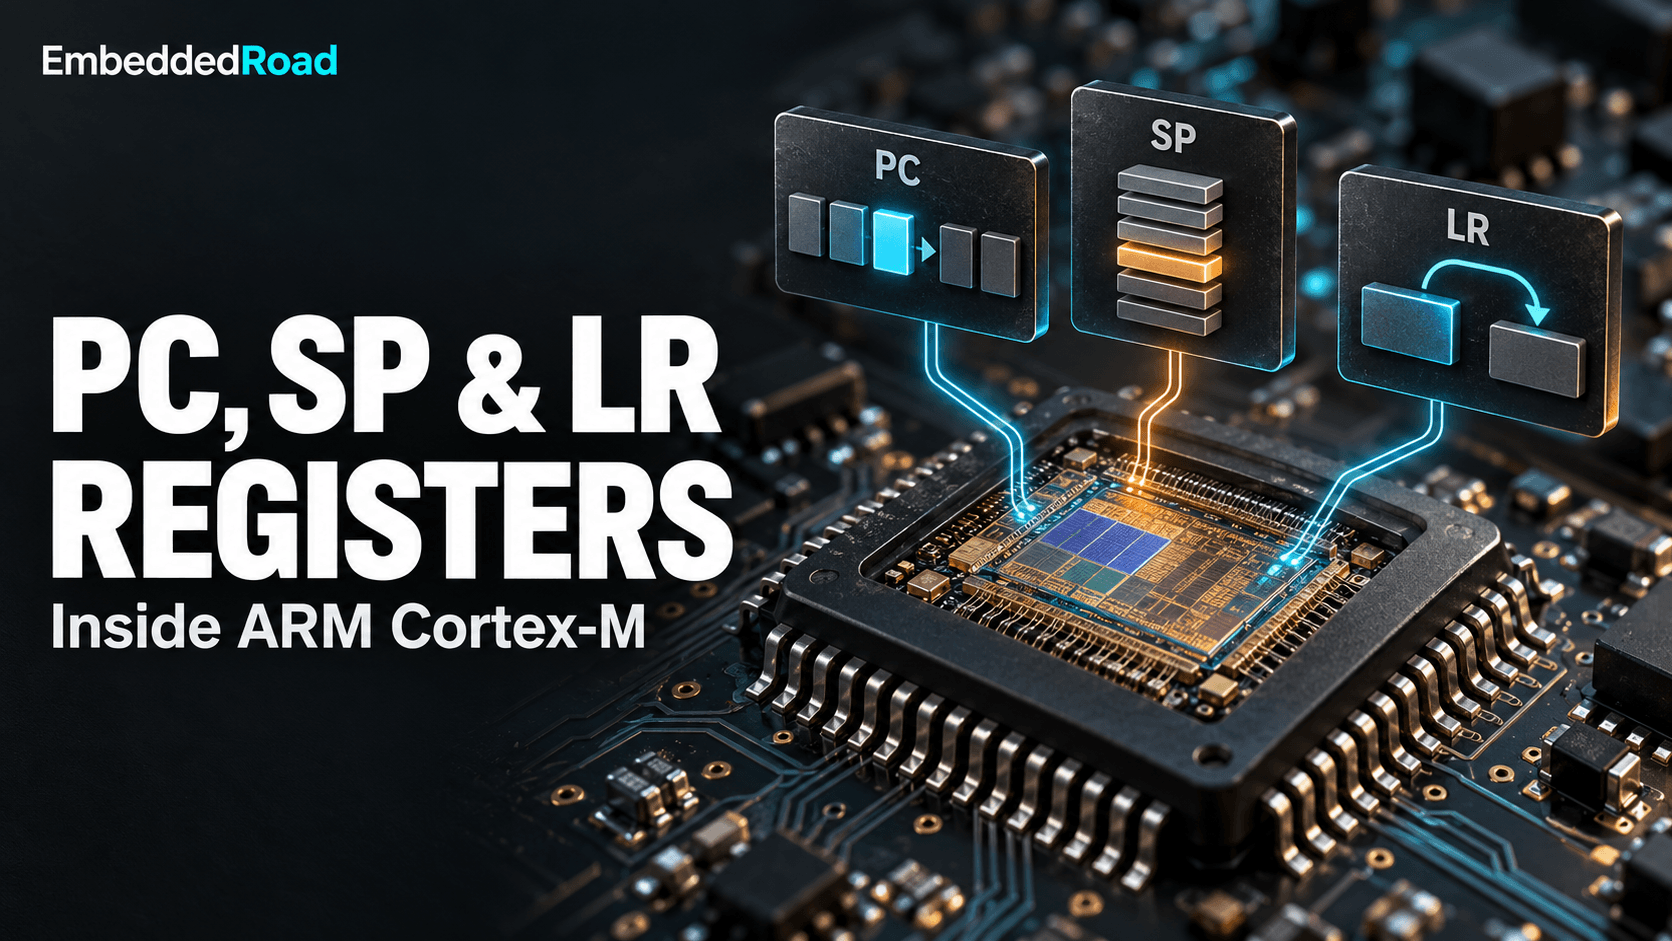
A CPU needs a handful of registers whose meaning is fixed by the architecture, not by the compiler, because the hardware itself — the fetch logic, the call instructions, the exception controller — must agree with software on where to find the next instruction and where the stack lives. General-purpose registers (R0–R12 on ARM Cortex-M) are free for the compiler to allocate however it likes: one function's R4 might hold a loop counter, another's might hold a pointer. The Program Counter (PC), Stack Pointer (SP), and Link Register (LR) can't work that way. Every branch instruction, every interrupt, every BL call depends on these three holding specific, predictable roles, so the architecture bakes their behavior into silicon rather than leaving it to convention.
How special registers differ from R0–R12 on ARM Cortex-M
On Cortex-M, PC is R15, LR is R14, and SP is R13 — they're part of the same 32-bit register file as R0–R12, but instruction encodings and hardware logic treat them specially. Writing to PC causes an immediate branch rather than storing a value for later use. SP is implicitly updated by PUSH, POP, and exception entry/exit, not just by explicit arithmetic. LR is automatically written by BL and BLX, and automatically consulted at the end of an exception handler. You can reference all three in ordinary assembly mnemonics, but the instruction set and the exception hardware impose rules on them that no general-purpose register carries.
The Program Counter (PC)
What the PC does: pointing to the next instruction
The PC holds the address of the next instruction the CPU will fetch, and every cycle of program execution is ultimately the PC advancing through memory in sequence or jumping to a new location. On Cortex-M, reading PC mid-instruction typically returns the current instruction's address plus 4 bytes, a quirk inherited from the classic ARM pipeline convention — worth knowing when you're hand-computing offsets in assembly, less relevant once you're relying on the assembler's own label resolution.
How PC increments during normal execution
In the normal case, the PC increases by the size of the instruction just fetched — 2 bytes for a 16-bit Thumb instruction, 4 bytes for a 32-bit Thumb-2 instruction — so instruction fetch, decode, and execute overlap in a pipeline rather than happening one at a time. The details of how many pipeline stages are involved, and how a mispredicted branch stalls them, vary significantly across the Cortex-M family; see ARM Cortex-M Pipeline Stages (M0 to M55) for how that affects timing-sensitive code.
PC behavior during branches, jumps, and function calls
A branch, call, or return overwrites the PC directly, discarding whatever the pipeline had already fetched past that point and forcing a refill — which is why branches cost more cycles than straight-line code. B and BL perform PC-relative branches encoded as signed offsets; BX and BLX branch to an absolute address held in a register, which is how function pointers and RTOS context switches redirect execution. Returning from a function is itself just a PC write — typically BX LR, or a POP that restores PC straight off the stack.
Alignment requirements (Thumb-2 and ARM mode implications)
Cortex-M cores execute Thumb and Thumb-2 instructions only, where PC values must be halfword-aligned (bit 0 clear in the stored instruction address, even though bit 0 is used as the Thumb-state flag in function pointers). Writing an odd-valued function pointer looks wrong but is correct ARM EABI convention — that low bit signals Thumb mode to BX/BLX and is masked off before actual fetch. Getting this wrong, for instance by casting a address incorrectly in a jump table, produces a hard fault, not silently wrong execution.
Reading and modifying PC in firmware
You rarely write PC directly in C; the compiler generates calls, returns, and branches for you. Direct PC manipulation shows up in bootloaders jumping to an application image, in RTOS context-switch code, and in fault handlers decoding a crash address — all cases usually written in inline assembly, discussed later in this article.
The Stack Pointer (SP)
Stack organization: full-descending vs. empty-ascending
ARM Cortex-M stacks are full-descending: SP always points at the last valid item pushed, and it decrements before a push, so the stack grows from high addresses toward low addresses. "Full" means SP points to occupied memory, not the next free slot (as in an "empty" convention); this matters when you're reading raw stack dumps and need to know whether the byte at SP is valid data or the next free byte.
ARM Cortex-M stack configuration and RTOS implications
Cortex-M actually implements two stack pointers — Main Stack Pointer (MSP) and Process Stack Pointer (PSP) — with only one active at a time, selected by a bit in the CONTROL register. A typical RTOS runs each task on its own PSP-backed stack while the kernel and exception handlers use MSP, so a stack overflow in one task's PSP region doesn't instantly corrupt the kernel's own stack — though without a memory protection unit it can still overwrite adjacent RAM.
Local variables, function parameters, and register spill
The compiler allocates a function's local variables and any spilled registers on the stack frame below the current SP, sized by the prologue's initial subtraction from SP. Parameters beyond the first four (R0–R3 under the standard calling convention) are passed on the caller's stack rather than in registers. Understanding this layout matters when reading disassembly or examining structures passed by pointer — the fundamentals of which are covered in C Language Basics: Pointers, Structs, Unions.
Stack overflow and underflow detection
Stack overflow happens when SP decrements past the bottom of its allocated region, typically into another task's stack, a global variable, or unmapped memory — the last of which triggers a hard fault via the Memory Management Fault or Bus Fault mechanism if an MPU is configured, but silently corrupts memory if it isn't. Cortex-M8-and-up cores with the Armv8-M architecture add a hardware Stack Limit register that faults immediately on violation; on cores without it, RTOS-level stack painting (filling unused stack with a known pattern at startup and checking how much survives) is the usual detection technique.
Compiler management of SP and manual manipulation risks
The compiler owns SP adjustments through function prologues and epilogues, and manual SP manipulation in inline assembly is one of the easiest ways to corrupt a call stack — if you decrement SP without a matching restore, or without preserving alignment, every return address and local variable above it becomes unreliable. The ARM EABI requires SP be 8-byte aligned at any public function boundary; violating that silently breaks any called function that uses double-word loads or stores.
The Link Register (LR)
Purpose: storing return addresses for function calls
LR holds the return address a function should jump back to when it finishes, set automatically by the call instruction rather than by the compiler pushing it explicitly. This single register is what lets RET-equivalent code (BX LR) work without consulting the stack for leaf functions — functions that call nothing else and so never need to preserve LR beyond the register itself.
BL (Branch with Link) and BLX instructions
BL label branches to a PC-relative address and simultaneously writes the address of the instruction following the BL into LR. BLX Rn does the same but branches to an absolute address in a register and can switch instruction sets on cores that support both ARM and Thumb — irrelevant on pure Cortex-M parts, relevant on Cortex-A/R cores that still support legacy ARM mode.
Nesting function calls and LR preservation on the stack
A function that itself calls another function must save LR before doing so, because the nested BL will overwrite it — this is why non-leaf function prologues almost always include PUSH {LR} or fold it into a multi-register push alongside R4–R11. Forgetting this in hand-written assembly is a classic bug: the function appears to work until it's called from a context where the overwritten LR is actually needed.
Exception entry and LR special values (EXC_RETURN)
On exception entry, Cortex-M hardware automatically pushes R0–R3, R12, LR, PC, and xPSR onto the active stack, then loads LR with a special EXC_RETURN value — not a real code address but an encoded pattern (for example indicating whether to return using MSP or PSP, and whether the interrupted code used the floating-point stack extension). Executing BX LR at the end of the handler, with this special value, triggers the hardware unstacking sequence rather than an ordinary branch. Misreading or corrupting LR inside a handler is a common cause of mysterious resets, because the CPU interprets garbage as an EXC_RETURN code.
Tail-call optimization and LR reuse
A compiler performing tail-call optimization can replace a final BL plus return with a plain B, reusing the caller's own LR value instead of pushing a new one — the callee returns directly to the original caller. This saves a stack push/pop pair but means a stack trace built from LR values will show one fewer frame than the source code's call nesting suggests, which is worth remembering when a debugger's backtrace looks shorter than expected.
Interaction During Function Calls
Calling convention: how PC, SP, and LR work together
A function call sequence is: the caller sets up arguments in R0–R3 (and the stack for extras), issues BL, which writes the return address into LR and the target address into PC; the callee pushes LR (and any registers it will clobber) onto the stack as it adjusts SP downward for its locals; on return, the callee pops those registers back, restores SP, and branches to the saved address via LR or a popped PC. All three registers move in a single choreographed sequence, and corruption of any one — a wild pointer write landing on the stack, say — breaks the whole chain.
Prologue and epilogue code generation by the compiler
The prologue typically looks like PUSH {R4-R7, LR} followed by SUB SP, SP, #N for locals; the epilogue reverses it with ADD SP, SP, #N and POP {R4-R7, PC} — note the trick of popping directly into PC instead of LR followed by a separate branch, which saves an instruction on Thumb-2. Compiler flags that affect frame layout, and how functions interact with translation-unit-local versus externally visible linkage, connect to decisions covered in Static, Inline, and Extern Linkage — an inline function, for instance, may have no prologue/epilogue at all because it's folded into its caller.
Frame pointers (R7/R11) and their relationship to SP
A frame pointer (R7 in Thumb code, R11 under some ABI variants) is an optional second reference point into the current stack frame, used so that locals can be addressed with a fixed offset even if SP itself moves during the function (for example around a variable-length array or an inner call with stack-passed arguments). Modern compilers often omit the frame pointer entirely at higher optimization levels, addressing locals directly off SP, which saves a register but makes manual stack unwinding harder without debug info.
ARM EABI (Embedded ABI) register preservation rules
| Register | Role | Preserved across calls? |
|---|---|---|
| R0–R3 | Arguments / return value | No (caller-saved) |
| R4–R11 | General purpose | Yes (callee-saved) |
| R12 | Intra-procedure scratch | No |
| SP (R13) | Stack pointer | Yes (restored by callee) |
| LR (R14) | Return address | No (overwritten by nested calls) |
| PC (R15) | Instruction pointer | N/A |
This table is the contract every compiled function and every hand-written assembly routine must honor; violate it — clobber R4 without saving it, say — and the bug may not surface until a specific, rarely-taken call path uses that register afterward.
Practical Debugging and Inspection
Reading PC, SP, and LR from a debugger or crash dump
A debugger attached via SWD or JTAG shows PC, SP, and LR as ordinary registers in its register view, and PC at a breakpoint tells you exactly which instruction is about to execute. In a hard-fault handler, the values pushed automatically to the stack at exception entry — including the faulting PC and the pre-exception LR — are recoverable by reading the stacked frame off the known stack pointer, which is the standard technique for building a minimal crash-dump handler.
Using register values to trace call stacks
A call stack is reconstructed by starting from the current PC and LR, then walking backward through saved LR values on the stack, each frame's size determined by matching disassembly against the stack contents — this is exactly what a debugger's backtrace feature automates, and why stripping debug symbols makes it so much harder to do by hand.
Common mistakes: corrupted SP and LR recovery
A corrupted SP (from a buffer overrun or a mismatched push/pop count) typically manifests as a hard fault on the next function return or interrupt, because the CPU pops garbage into PC. A corrupted LR shows up similarly but only on the next return from the function that clobbered it, which can make the fault appear far from its actual cause — checking that every PUSH {..., LR} has a matching POP {..., PC} is the first thing to verify when chasing this class of bug.
Assembly and C Code Perspective
How inline assembly accesses these registers
GCC and Clang inline assembly can reference PC, SP, and LR by name ("sp", "lr", or via compiler intrinsics like __builtin_frame_address), and CMSIS provides portable intrinsics such as __get_PSP() and __set_PSP() specifically for RTOS context-switch code — the same style of direct hardware access used for peripheral registers, as covered in Register-Level Peripheral Access via CMSIS.
Compiler constraints when modifying special registers
Modifying SP or LR inside inline assembly without declaring it as clobbered is undefined behavior from the compiler's perspective — it may keep values cached in registers that your assembly has just invalidated. GCC's extended asm syntax requires explicit clobber lists; getting this wrong produces bugs that appear only under certain optimization levels, because -O0 happens to reload values from memory anyway while -O2 doesn't.
When and why you might need direct register manipulation
Direct manipulation of PC, SP, or LR is legitimate in a narrow set of cases: RTOS schedulers performing context switches, bootloaders jumping into application code, fault handlers extracting crash context, and startup code initializing the stack before main() runs. Outside those cases, if you find yourself wanting to touch these registers directly in application code, it's usually a sign the problem belongs in C, where the compiler's calling convention already does this bookkeeping correctly.
Learning
Sign in to track your progress.
Evidence
Public projects engineers linked to Program Counter, Stack Pointer, Link Register.
No engineer has linked a project to this topic yet. Built something that proves it? Add the project and tag it with embedded-firmware-program-counter-stack-pointer-link-register — it then shows here and on your public profile.